How We Calculate Your Human Impact Metrics
12 min read
At Humankind, our mission is to invest and encourage others to invest in the manner that’s best for humanity. That’s why we like to measure the success of our investments not only based on the value they create for you inside your portfolio as an investor, but also the value they create for you outside of your portfolio as a human being generally. We use a proprietary metric called Humankind Value to estimate each company’s contribution to humanity – how they are impacting people across a variety of thematic issues, like climate change, gun manufacturing, tobacco, healthcare access, free digital services, food and water access, etc.
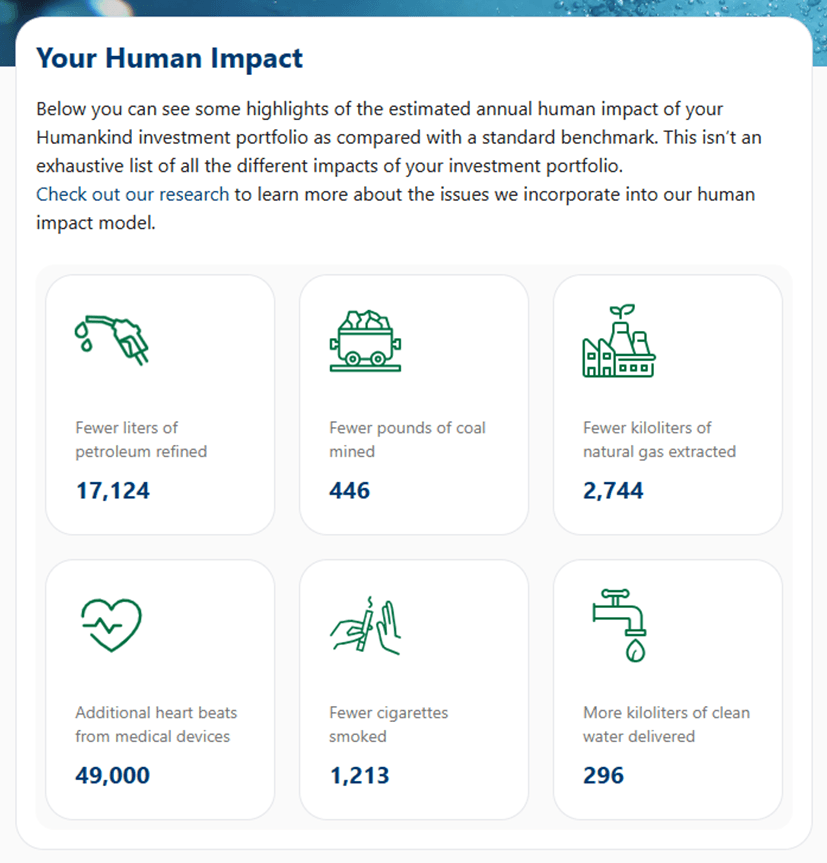
In our Humankind Portfolios accounts, we have worked to select ETFs that we believe give you more responsibility for the good things in life and less responsibility for the bad things in life – in other words, those ETFs that create more Humankind Value. We’ve chosen to highlight six specific human impact metrics to give you a more concrete idea of how your Humankind Portfolio compares to a traditional investment portfolio in terms of its positive and negative impact on humanity. The numbers that you see on your human impact page therefore represent estimates of some of the key human impact differences between your portfolio and a traditional one, constructed using industry standard broad-based benchmark indices. It is important to understand that the individual human impacts that we present to you are not a precise measurement - rather they represent a good faith estimate based on our internal calculation methodology, as described below
First, we calculate each of the six metrics for each ETF in the portfolio, analyzing its underlying index composition and that of its broad-based industry standard index benchmark. Then, we subtract the benchmark index metrics from the portfolio index metrics to get the difference metrics. Finally, for each difference metric, we take a weighted sum based on the index’s weight in your portfolio, and that’s how we arrive at the portfolio-level number for each metric that is displayed on your Human Impact page.
If you’d like to better understand how we calculate each of those metrics for each ETF, please check out the next six below paragraphs which provide examples comparing the Humankind US Equity Index, tracked by one of the funds chosen to be part of Humankind Portfolios, to its benchmark index, the S&P Composite 1500 Index (“S&P 1500 Index”)*. Warning: This gets a bit technical.
Petroleum Refineries
The sector for petroleum refineries contains the NAICS code 324110. Per $1 invested, the Humankind US Equity Index and the S&P 1500 Index have petroleum refinery revenue exposures of $0 and $0.015932, respectively. The difference, -$0.015932 of petroleum refinery revenue, can be converted to a difference in the quantities of petroleum refined and greenhouse gas emissions produced. The density of refined petroleum is approximately 750 kg per 1,000 liters (Fuels - Densities and Specific Volumes | Engineering ToolBox). Globally, 3,935 million tonnes of petroleum refinery output is produced (World refinery output by product, 1971-2019 | iea). Global revenue for this sector is $563.3 B (Global Oil Refinery market is projected to grow at a CAGR of 1.9% by 2023: Visiongain Reports Ltd | GlobeNewswire). Combining this information, and scaling for the dollars invested in the index in your portfolio, yields the decrease in liters of refined oil that your portfolio is responsible for from investing in the Humankind US Equity Index as compared with its benchmark, the S&P 1500 index.
For a hypothetical single dollar investment, that comes out to: (-$0.015932 Refinery Revenue / $1 investment) × (3,935,000,000 tonnes refined oil / $563,300,000,000 Refinery Revenue) × (1,000 liters refined oil / .75 tonne refined oil) ≈ 0.1484 fewer liters of refined oil.
Coal Mining
The sector for coal mining contains the NAICS code 211130. Per $1 invested, the Humankind US Equity Index and the S&P 1500 Index have crude oil and natural gas extraction revenue exposures of $0 and $0.00002505, respectively. The difference, -$0.00002505 of coal mining revenue, can be converted to a difference in the quantities of coal mined and greenhouse gas emissions produced. Coal mining had a global revenue of $2.08 T in 2022 (Global coal mining market value 2010-2024 | Statista). This corresponds to 7,574,000,000 tonnes of coal mined (Global coal production, 2018-2021 | iea). Combining this information, and scaling for the dollars invested in the index in your portfolio, yields the decrease in pounds of coal that your portfolio is responsible for from investing in the Humankind US Equity Index as compared with its benchmark, the S&P 1500 index.
For a hypothetical single dollar investment, that comes out to: (-$0.00002505 Coal Mining Revenue / $1 investment) × (7,574,000,000 tonnes coal / $2,080,000,000,000 Coal Mining Revenue) × (2,200 pounds / tonne) ≈ 0.00020 fewer pounds of coal.
Natural Gas Extraction
The sector for crude oil and natural gas extraction refineries contains the NAICS codes 211120, 213111, 213112, 211130, 486110, and 486210. Per $1 invested, the Humankind US Equity Index and the S&P 1500 Index have crude oil and natural gas extraction revenue exposures of $0.00004767 and $0.006692, respectively. The difference, -$0.006644 of crude oil and natural gas extraction revenue, can be converted to a difference in natural gas extracted. 4,040,000,000,000,000 liters of natural gas are extracted annually (Global natural gas production 2024 | Statista). Global annual revenue for this sector is $5 T (Global Oil & Gas Exploration & Production | IBISWorld). Oil and natural gas’ combined $5 T revenue can be disaggregated: Oil cost an average of $83 per barrel in 2023 (Brent crude oil prices averaged $19 per barrel less in 2023 than 2022 | EIA), and an average of 102 million barrels of oil were produced per day (Short-Term Energy Outlook | EIA). 365 days * 102 million barrels/day * $83/barrel = $3 T, the revenue for the oil extraction industry. $5 T - $3T = $2 T, the revenue of the natural gas extraction industry. Combining this information, and scaling for the dollars invested in the index in your portfolio, yields the decrease in liters of natural gas extracted that your portfolio is responsible for from investing in the Humankind US Equity Index as compared with its benchmark, the S&P 1500 index.
For a hypothetical single dollar investment, that comes out to: (-$0.006644 Extraction Revenue / $1 investment) × (4,040,000,000,000,000 liters natural gas / $2,000,000,000,000 Extraction Revenue) ≈ 13.4 fewer liters natural gas
Cardiac Devices
The sector for cardiac devices contains the NAICS code 334510. Only 23.6 percent of revenue in this sector is attributed to cardiac devices (NAICS Code 334510 - Electromedical and Electrotherapeutic Apparatus Manufacturing | IBISWorld). Per $1 invested, the Humankind US Equity Index and the S&P 1500 Index have cardiac device revenue exposures of $0.007093 and $0.003205, respectively. The difference, $0.003888 of cardiac device revenue, can be converted to a difference of the number of heartbeats gained from devices. The average heart rate is 80 beats per minute (Beats Per Life | Public Science Lab). One year of extra life lived can be attributed to a cardiac device (Cost-Effectiveness of Left Ventricular Assist Devices in Ambulatory Patients With Advanced Heart Failure | JACC; Cost-Effectiveness Analysis of Continuous-Flow Left Ventricular Assist Devices as Destination Therapy | AHA Journals). 1,400,000 cardiac implants are installed annually (Experience of cardiac implantable electronic device lead removal from a South African tertiary referral centre | PMC). In 2023, the global cardiology devices market was associated with $68.35 B revenue (Cardiology Devices - Worldwide | Statista). Combining this information, and scaling for the dollars invested in the index in your portfolio, yields the additional heartbeats that your portfolio is responsible for from investing in the Humankind US Equity Index as compared with its benchmark, the S&P 1500 index.
For a hypothetical single dollar investment, that comes out to: ($0.003888 cardiac device revenue / $1 investment) × (1,400,000 cardiac devices / $68,350,000,000 cardiology devices revenue) × (1 year of life / cardiac device) × (525,600 minutes / year) × (80 heartbeats / minute) ≈ 0.80 additional heartbeats due to medical devices.
Tobacco
The sector for tobacco contains the NAICS codes 312230 and 424940. Per $1 invested, the Humankind US Equity Index and the S&P 1500 Index have tobacco revenue exposures of $0 and $0.001291, respectively. The difference, -$0.001291 of tobacco revenue, can be converted to a difference in the number of cigarettes smoked. 5.2 trillion cigarettes are smoked annually (Global cigarette consumption from 1880 to 2020 | Statista). Global revenue for tobacco is $912 B (Global Tobacco: Emerging Trends and Risks Posed to Investors | ISS). Combining this information, and scaling for the dollars invested in the index in your portfolio, yields the decrease in number of cigarettes smoked that your portfolio is responsible for from investing in the Humankind US Equity Index as compared with its benchmark, the S&P 1500 index.
For a hypothetical single dollar investment, that comes out to: (-$0.001291 Tobacco Revenue / $1 investment) × (5,200,000,000,000 cigarettes smoked / $912,000,000,000 Tobacco Revenue) ≈ 0.0079 fewer cigarettes smoked.
Water
The sector for water access contains the NAICS code 221310. Per $1 invested, the Humankind US Equity Index and the S&P 1500 Index have water revenue exposures of $0.0011125 and $0.0000805, respectively. The difference, $0.001032 of water access revenue, can be converted to a difference in the number of people with access to safe drinking water. Globally, 90% of people have access to at least basic drinking water services (Progress on Sanitation and Drinking Water | WHO). There is a total revenue of $655 B (Market share of water markets worldwide as of 2021, by subsector | Statista). Combining this information, and scaling for the dollars invested in the index in your portfolio, yields the increase in people with access to safe drinking water that your portfolio is responsible for from investing in the Humankind US Equity Index as compared with its benchmark, the S&P 1500 index.
For a hypothetical single dollar investment, that comes out to: ($0.001032 Water Revenue / $1 investment) × (90% × 8,050,000,000 people with water access / $655,000,000,000 Water Revenue) ≈ 0.000011 morepeople with water access.
Additional Notes
*The S&P Composite 1500 Index is a broad measure of the investable U.S. equity market, which includes the stocks of large-cap, mid-cap and small-cap issuer companies. Unless otherwise stated, index returns do not reflect the effect of any applicable fees, expenses or taxes. It is not possible to invest directly an index.
Data
Impact calculations are derived from data obtained from sources believed to be reliable, including data self-reported by companies or estimated by data aggregators. Sources used for our impact examples are identified in this section. Data used for impact calculations range from 2012 – 2023. Impact data coverage may be limited or vary across companies and industries. Humankind makes a good faith effort to conduct its research using the most current data available. Humankind does not guarantee the accuracy, adequacy, or completeness of third-party data.
Use of Funds for Calculations
Typically, when making these human impact metric calculations we use public data from funds which track the indexes that we are trying to analyze. For example, for the S&P 1500 in the example above, we used the SPTM ETF.
Other Indexes
For a full list of indexes used in your Humankind Portfolio and their respective broad-based benchmarks which are used for human impact comparison purposes, click here.
Rounding
All final answers follow the convention of significant figures. In cases where a final value is precise to one or more decimal places but has units that are naturally integers, e.g. “number of deaths,” this value is always rounded down to the lower whole number. More information can be found at Significant Digits | Analytical Chemistry.
All values are in US Dollars, where M=Million, B=Billion, T=Trillion.
Revenue Exposure
A portfolio contains holdings. Each holding is associated with its weight in the portfolio w, its market value v, and an issuing entity. The issuing entity is associated with an enterprise value e, and sources of revenue.
A sector is defined using NAICS National Industry codes. Within a sector, an issuing entity has revenue r sector.
The portfolio revenue exposure formula quantifies the extent to which $1 invested in a portfolio finances the revenue of a given sector. It can be expressed as the sum, across all portfolio holdings, of (vwr sector)/e.
_____________________________________________________________________________________________
Other Information
Advisory services provided to clients by Humankind Investments LLC (“Humankind”), an SEC-registered investment adviser.
Brokerage services provided to clients by Apex Clearing Corporation, a SEC-registered broker-dealer and member of FINRA/SIPC.
Humankind’s internet-based socially responsible advisory service (“Humankind Portfolios” or “the Program”) is designed to assist clients in achieving discrete financial goals. Clients are invested in portfolios of securities selected by Humankind based upon information provided by clients to Humankind. The investments that comprise the portfolios consist of various exchange-traded funds (“ETFs”). The ADV brochure (Part 2A, Part 2B) and Investment Management Agreement for the Program describe the conflicts of interest presented by the Program and the actions Humankind takes to address them.
Humankind uses a proprietary metric, called “Humankind Value” to select and manage the ETFs that comprise the investments in client portfolios. Humankind Value is a single dollar value which is intended to capture the aggregate worth of a company based upon its economic impact on humanity, defined as investors, customers, employees, and society at large. It’s important to understand that this single dollar value of Humankind Value for a company is not a precise measurement of the economic impact that companies have on humanity – rather, it represents a good faith estimate based on Humankind’s internal model of how these companies behave and what the estimated impact on humanity of their behavior is. In other words, Humankind seeks to create a simplified mathematical representation of the real world and are using that to derive this single dollar value for a company. See the ADV brochure (Part 2A, Part 2B) for additional information on this metric and how Humankind uses it in its investment advisory process.
Humankind may also present to clients estimates of the human impact of their portfolio as compared with a standard benchmark portfolio, across a sampling of themes. For example, without limitation, Humankind may present the number of cigarettes smoked their portfolio is responsible for as compared with the benchmark portfolio, or the number of people that their portfolio has provided access to clean water to as opposed to the standard benchmark portfolio, etc. It’s important to understand that these individual human impacts presented to clients are not a precise measurement– rather, they represent a good faith estimate based on our internal methodology. This human impact estimate methodology is made available to clients.
The Program is not intended to provide comprehensive financial planning with respect to every aspect of a client's financial situation and does not incorporate specific investments that clients hold elsewhere. Additionally, the Program does not customize investment portfolio construction based on clients' unique ethical preferences. Information on clients’ unique ethical preferences that is collected by the Program can be used for customized client communications.
Before investing, consider your investment objectives and the Program’s fees and expenses. For more details about the Program, see our Form CRS, Form ADV brochure and brochure supplement.
Investing involves risk and there is the potential of losing money when you invest in securities. Past performance does not guarantee future results.
Get the latest posts in your inbox
I agree to the Terms of Use and acknowledge that I have read the Privacy Policy.